Performance Report for Hive Fabric with Intel Optane
How Tests were Carried Out
About the Environment
Intel provided remote access to their lab where the following servers were made available for testing. Each server was configured with the Optane memory configured in Memory mode with DDR4 memory configured as memory cache.
Hive Fabric can deploy stateless VDI to any storage presented to its host, the test servers were configured with standard SSD’s, NVMe SSD’s and Optane SSD’s which enabled comparative tests to be carried out.
Test Servers
| Host | CPU | Chassis | Motherboard | Storage | Memory (RAM) |
|---|
| Host 1 | 2 x Intel Xeon Cascade Lake 6240R | Intel® Server Chassis R2208WFXXX | Intel® Server Board S2600WFTR |
1x Intel SSD DC P3700 Series 400GB
1x Intel Optane SSD DC P4800X 375GB |
12 x 16Gb DDR4 2666 = 192Gb
12x Intel SSD Apache Pass 512GB = 6144Gb |
| Host 2 | 2x Intel® Xeon® CLX 8280L | Intel® Server Chassis R2208WFXXX | Intel® Server Board S2600WFT |
1x Intel SSD DC P4600 Series 1.6TB
1x Intel Optane SSD DC P4800X 375GB |
12 x 16Gb DDR4 2666 = 192Gb
12x Intel SSD Apache Pass 512GB = 6144Gb |
Benchmark Tests Used
Two main tests were completed for the evaluation, these were:
-
Iometer Test – is an I/O subsystem measurement and characterization tool for single and clustered systems. It is used as a benchmark and troubleshooting tool and is easily configured to replicate the behavior of many popular applications. One of the main outputs used by the tool is the overall and read / write IOPs achieved from the test scenario. It is well established that disk performance is the primary factor in delivering a good end user experience and one of the main challenges VDI had historically was delivering sufficient IOP’s from the storage that supported virtual desktop infrastructure.
-
PassMark Performance Test – this is an industry standard benchmarking test for disk performance and provides an overall DiskMark score that can be used to compare against other similar disks. This Diskmark score is calculated from the various read and writes carried out and other tests to deliver an overall score that can be compared against different disks. While PassMark provides a database of most industry disks available in the market, it should be noted that when used for virtualization only a part of the actual hard disk is provisioned to the virtual machine. However, the test carried out were the same for all test scenarios so resultant comparison was considered fair and equal.
Test Scenarios & Configurations
The above tests were then carried out against the following virtual desktop configurations:
| Test Reference | VM Specification | VM Deployed to 1 |
|---|
| VDI-4G-SSD | Stateless VDI /2vCPU/4Gb RAM | Local Disk – Standard SSD |
| VDI-8G-SSD | Stateless VDI /2vCPU/8Gb RAM | Local Disk – Standard SSD |
| VDI-4G-NVME | Stateless VDI /2vCPU/4Gb RAM | Local Disk – NVMe SSD |
| VDI-8G-NVME | Stateless VDI /2vCPU/8Gb RAM | Local Disk – NVMe SSD |
| VDI-4G-OPTANE | Stateless VDI /2vCPU/4Gb RAM | Local Disk – Optane SSD |
| VDI-8G-OPTANE | Stateless VDI /2vCPU/8Gb RAM | Local Disk – Optane SSD |
| VM-4G-OPTANE/NFS | VM /2VCPU/4Gb RAM | NFS Shared Local Disk - Optane SSD |
| VM-8G-OPTANE/NFS | VM /2VCPU/8Gb RAM | NFS Shared Local Disk - Optane SSD |
| VDI-4G-RAM | Stateless VDI /2vCPU/4Gb RAM | RAM – STANDARD DDR4 Memory |
| VDI-8G-RAM | Stateless VDI /2vCPU/8Gb RAM | RAM – STANDARD DDR4 Memory |
| VDI-4G-RAM+Optane | Stateless VDI /2vCPU/4Gb RAM |
RAM – STANDARD DDR4 Memory
Cache + Optane Persistent Memory |
| VDI-8G-RAM+Optane | Stateless VDI /2vCPU/8Gb RAM |
RAM – STANDARD DDR4 Memory
Cache + Optane Persistent Memory |
**Note
1 "VM deployed to.." this refers to where the virtual desktop OS is deployed in respect to storage, this is often referred to the "Delta Disk" or "OS Disk"
Iometer Test Results
Overview
Iometer is an I/O subsystem measurement and characterization tool for single and clustered systems. One commonly quoted measurement provided by the tool is IOPS. It is used as a benchmark performance and for this report tests were carried using test files of 0.5Gb and 10.0Gb on a single desktop image on the host server.
The results were as follows:
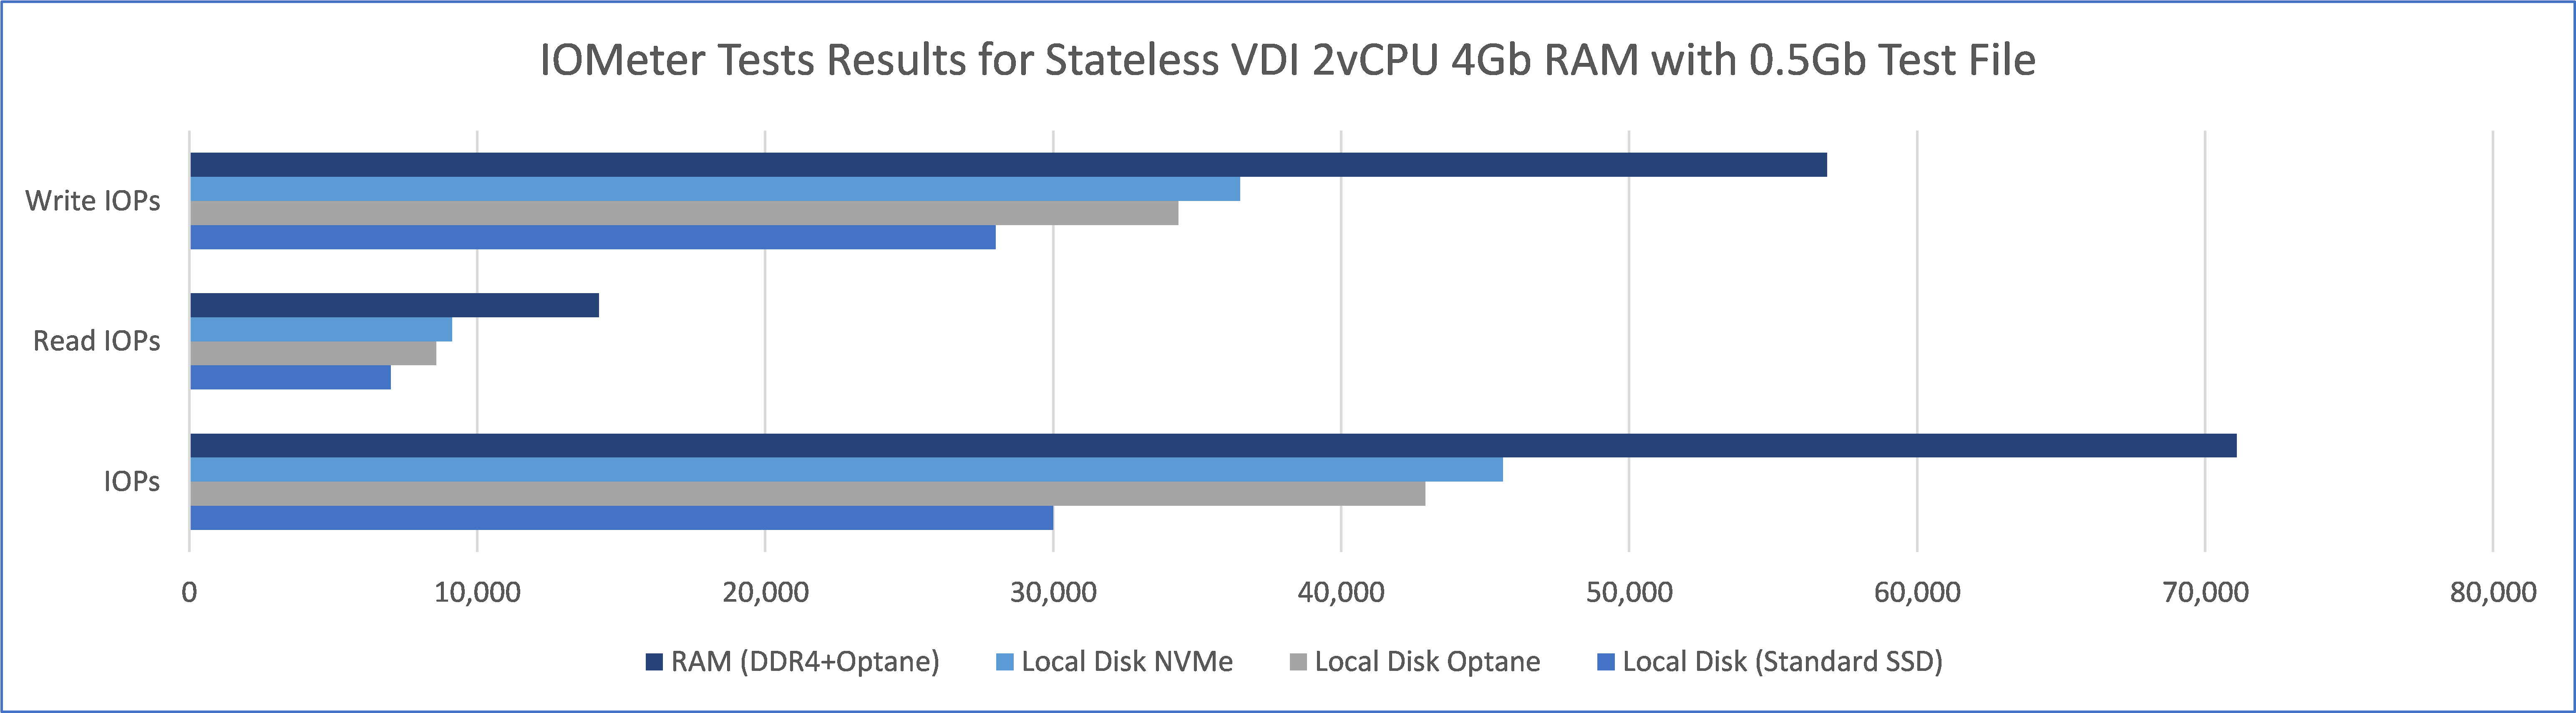 Figure 1:- IOPs performance results for a 2vCPU 4Gb RAM Stateless VDI against a 0.5Gb test File
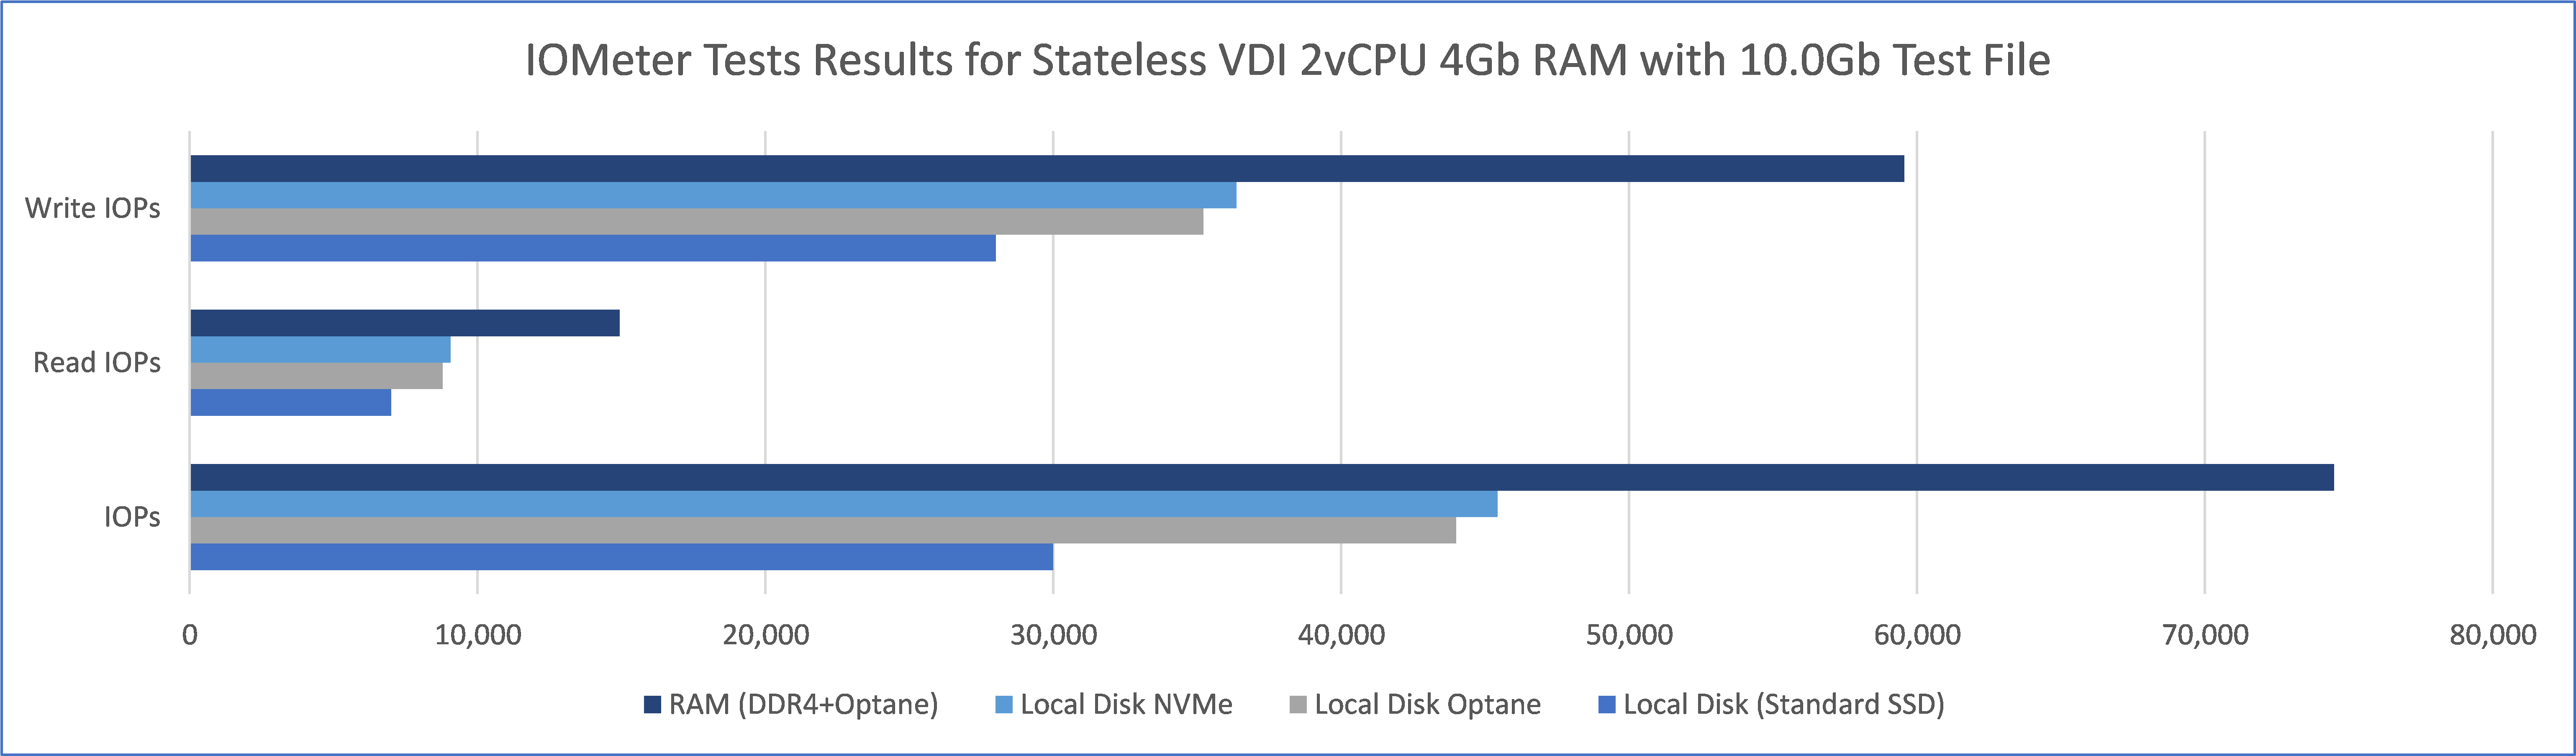 Figure 2:- IOPs performance results for a 2vCPU 4Gb RAM Stateless VDI against a 10.0Gb test File
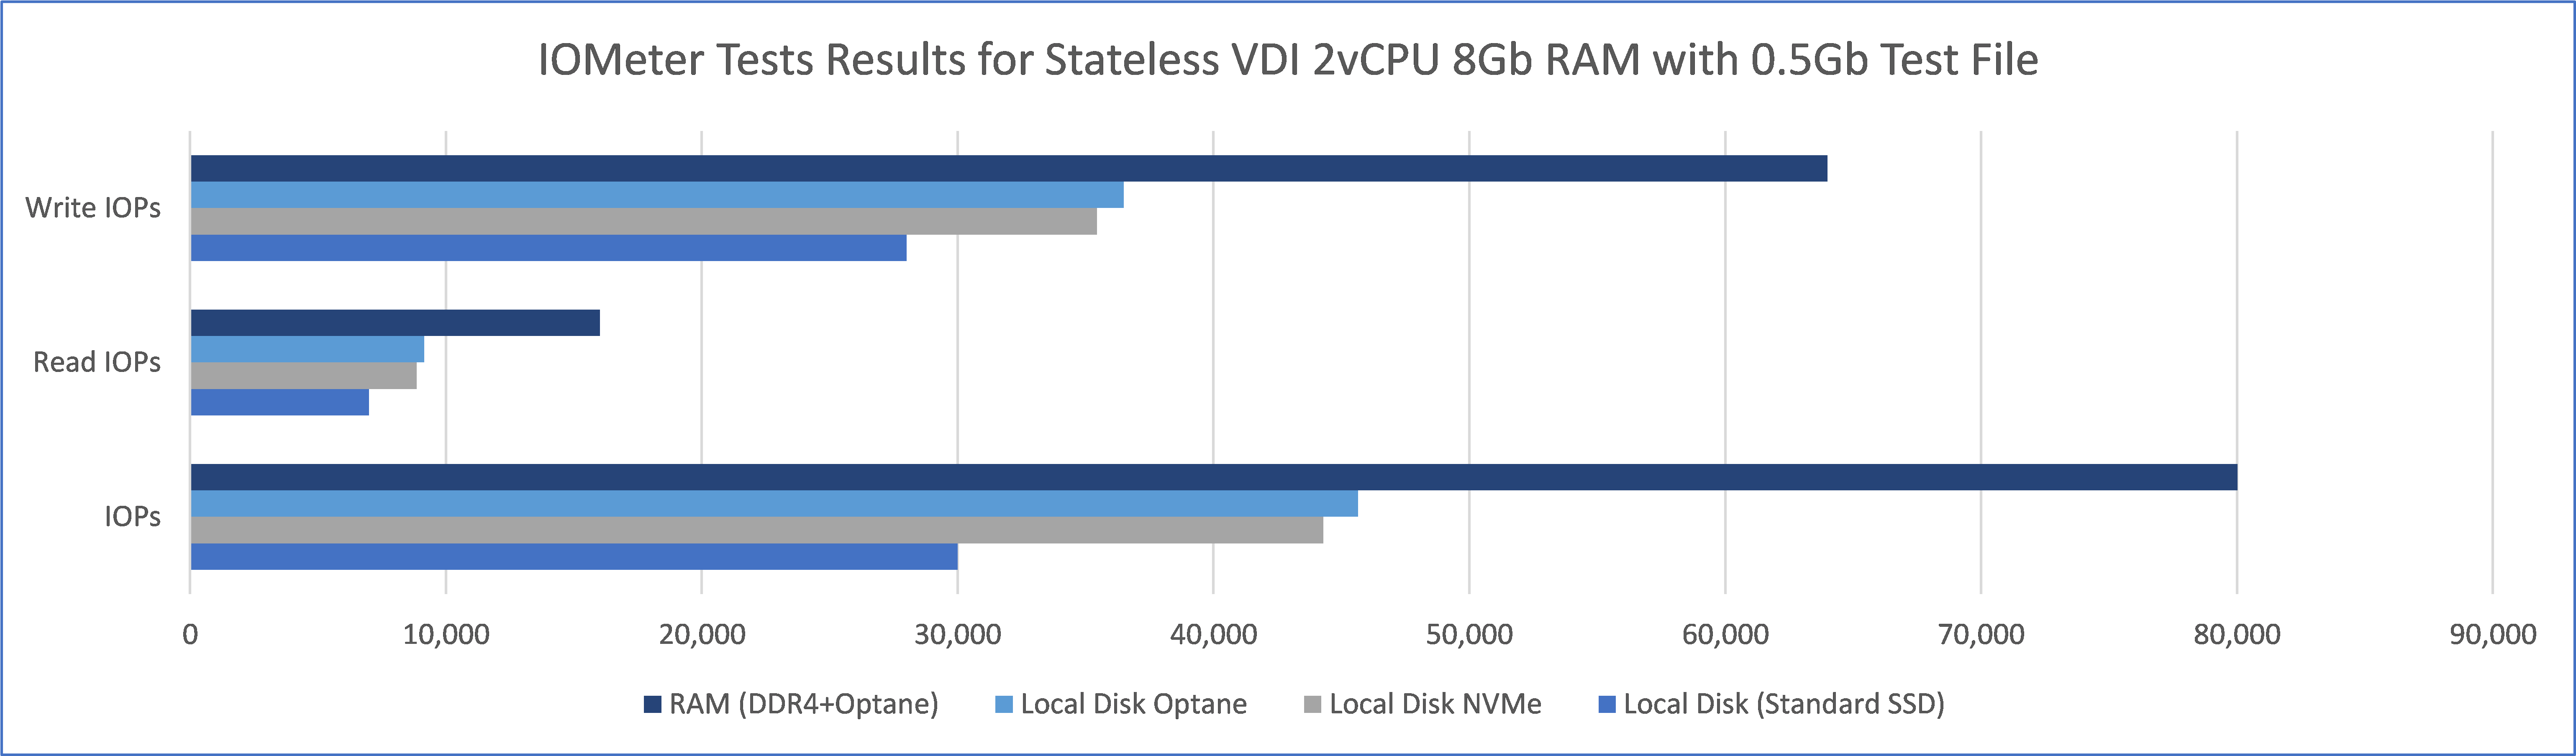 Figure 3:- IOPs performance results for a 2vCPU 8Gb RAM Stateless VDI against a 0.5Gb test File
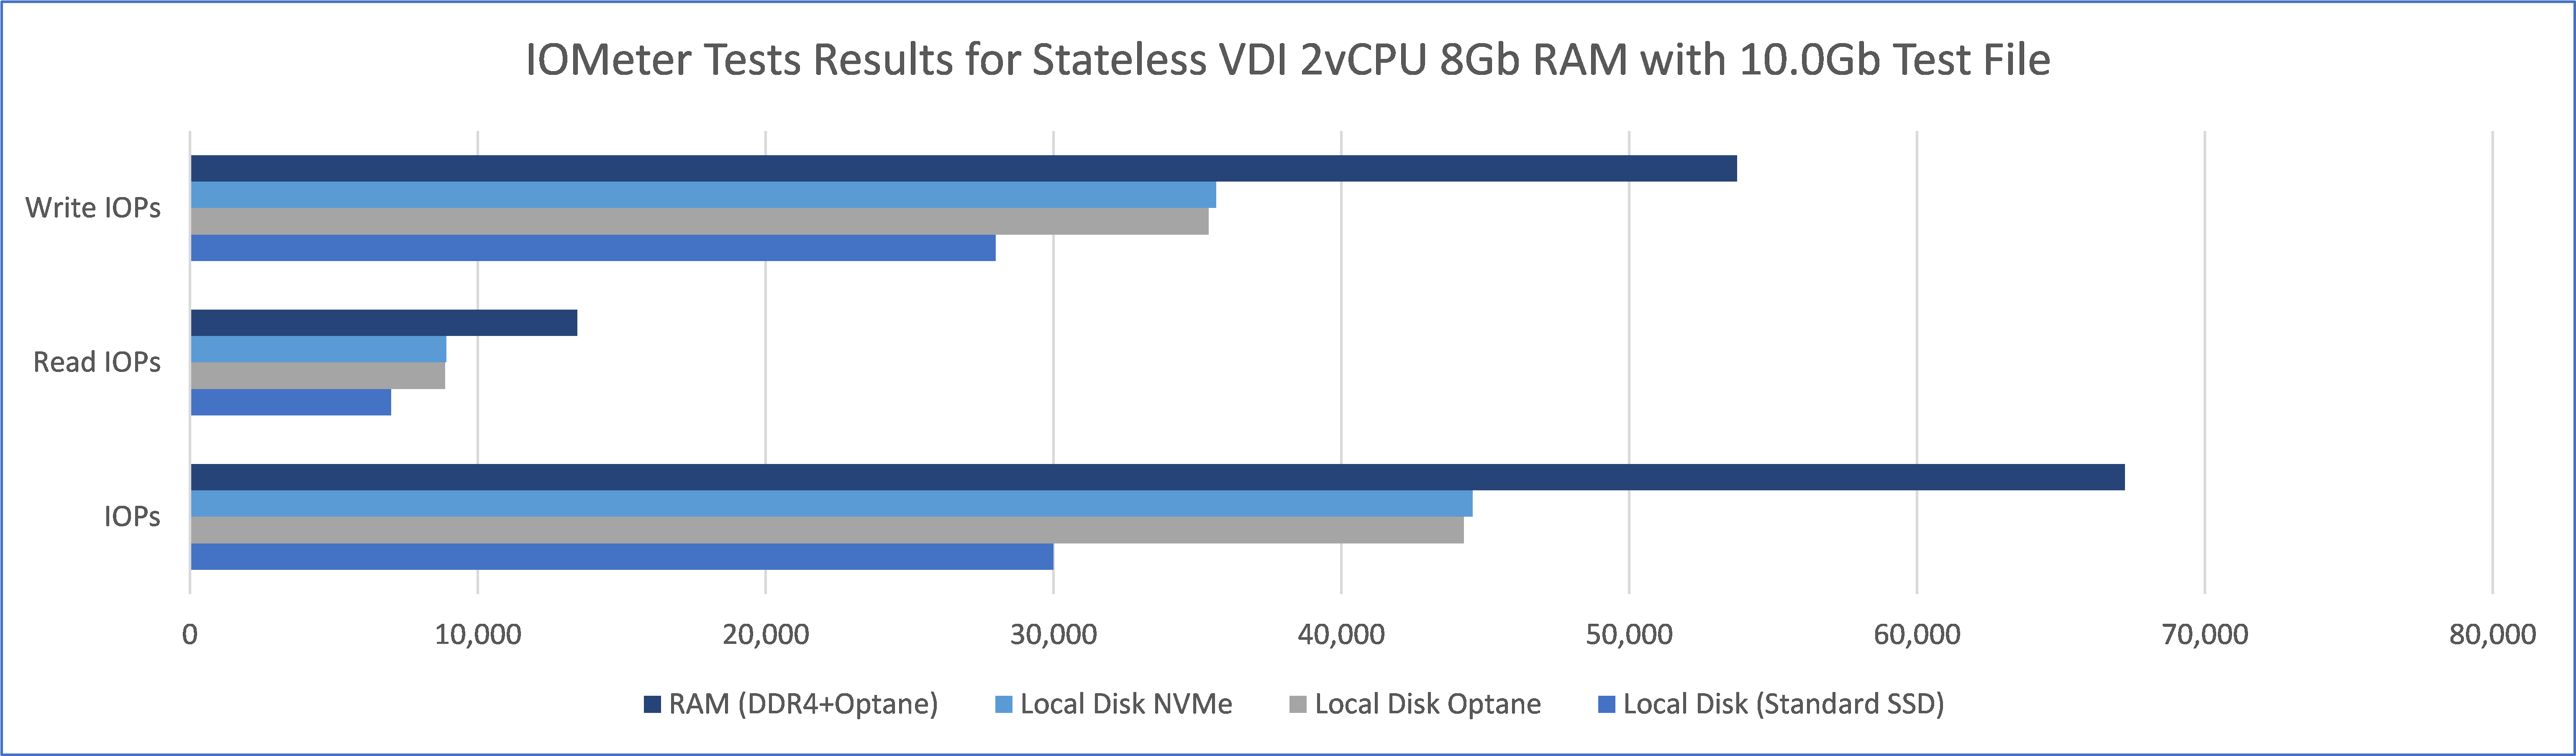 Figure 4:- IOPs performance results for a 2vCPU 8Gb RAM Stateless VDI against a 10.0Gb test File
Average Response Times for the tests completed were as follows:
| Configuration | Average Response Time | Average Read Response Time | Average Write Response Time |
|---|
| RAM (DDR4+Optane) 8G RAM -05Gb Test File | 0.3995 | 0.3428 | 0.4137 |
| RAM (DDR4+Optane) 4G RAM -10Gb Test File | 0.4292 | 0.3616 | 0.4461 |
| RAM (DDR4+Optane) 4G RAM -05Gb Test File | 0.4497 | 0.3761 | 0.4681 |
| RAM (DDR4+Optane) 8G RAM -10Gb Test File | 0.4756 | 0.4141 | 0.4910 |
| Local Disk (Optane) 8G RAM -05Gb Test File | 0.7004 | 0.5080 | 0.7486 |
| Local Disk (NVMe) 4G RAM -05Gb Test File | 0.7008 | 0.5043 | 0.7500 |
| Local Disk (NVMe) 4G RAM -10Gb Test File | 0.7039 | 0.5055 | 0.7533 |
| Local Disk (NVMe) 8G RAM -10Gb Test File | 0.7173 | 0.5192 | 0.7668 |
| Local Disk (NVMe) 8G RAM -05Gb Test File | 0.7216 | 0.5314 | 0.7692 |
| Local Disk (Optane) 8G RAM -10Gb Test File | 0.7221 | 0.5202 | 0.7727 |
| Local Disk (Optane) 4G RAM -10Gb Test File | 0.7267 | 0.5182 | 0.7788 |
| Local Disk (Optane) 4G RAM -05Gb Test File | 0.7448 | 0.5343 | 0.7974 |
Figure 5:-Average response time obtained from Iometer tests, these are checked to ensure IOPs and Latency are in sync.
Summary Observations
The results from the Iometer tests show that desktops deployed in RAM utilizing Optane persistent memory consistently outperformed the highest performing desktops from local disk by a minimum of 56%. Desktops deployed to local disk where the local disk was either NVMe or Optane SSD performed well but were not as good as when deployed in RAM. They consistently performed 266% better than a standard SSD.
Performance Disk Mark Test
Overview
This Advanced Disk Test, which is part of Performance Test, measures the data transfer speed when reading or writing data to one or more disks. The speed that data can be transferred between memory and a hard disk drive is one of a system's most important performance aspects. There are quite a few factors which have a bearing on this speed and the Advanced Disk Drive Test allows the user to vary most of these factors and compare the results. The overall result is indicated by the Disk Mark Number and this can be compared to benchmarks from all other disks noting that the tests were on stateless VDI where the virtual disk is presented from the server’s storage disks.
Results
Again, like the Iometer tests these were carried out against stateless VDI session of a 2vCPU and 4GB RAM and 8GB RAM respectively, this was done to ensure that the additional memory did not disproportionately change the results.
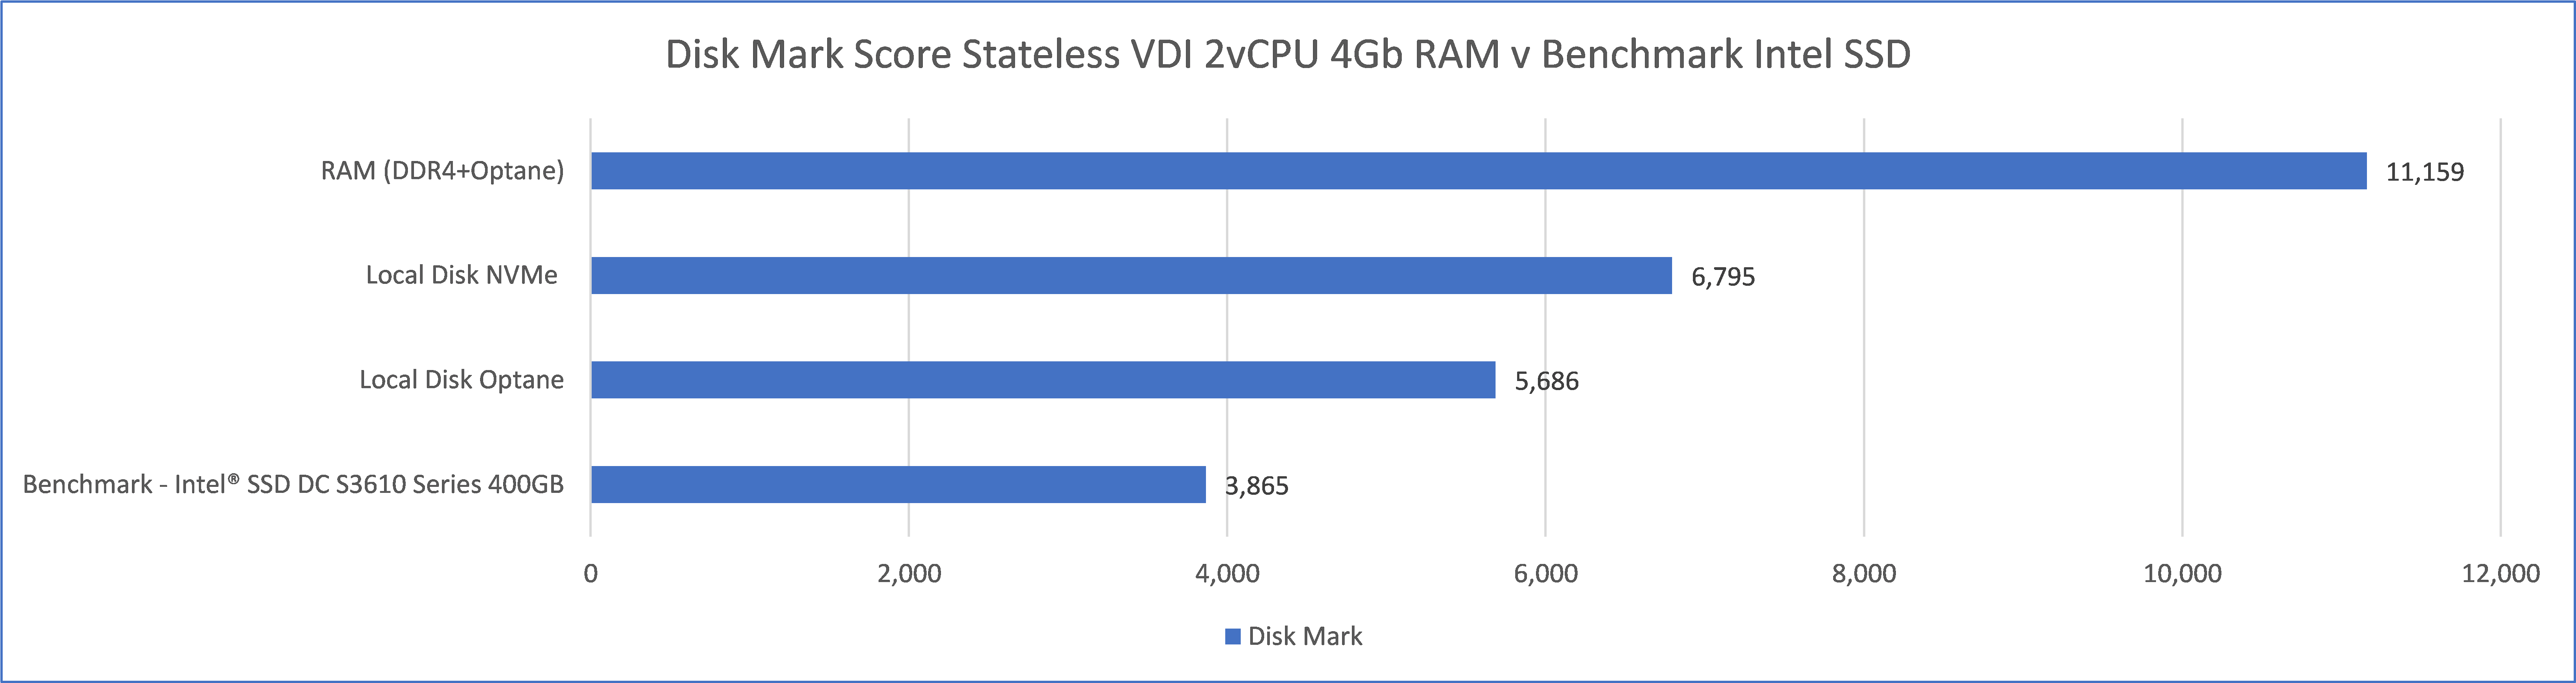 Figure 6:-Disk Mark results for Stateless VDI 2vCPu and 4Gb RAM
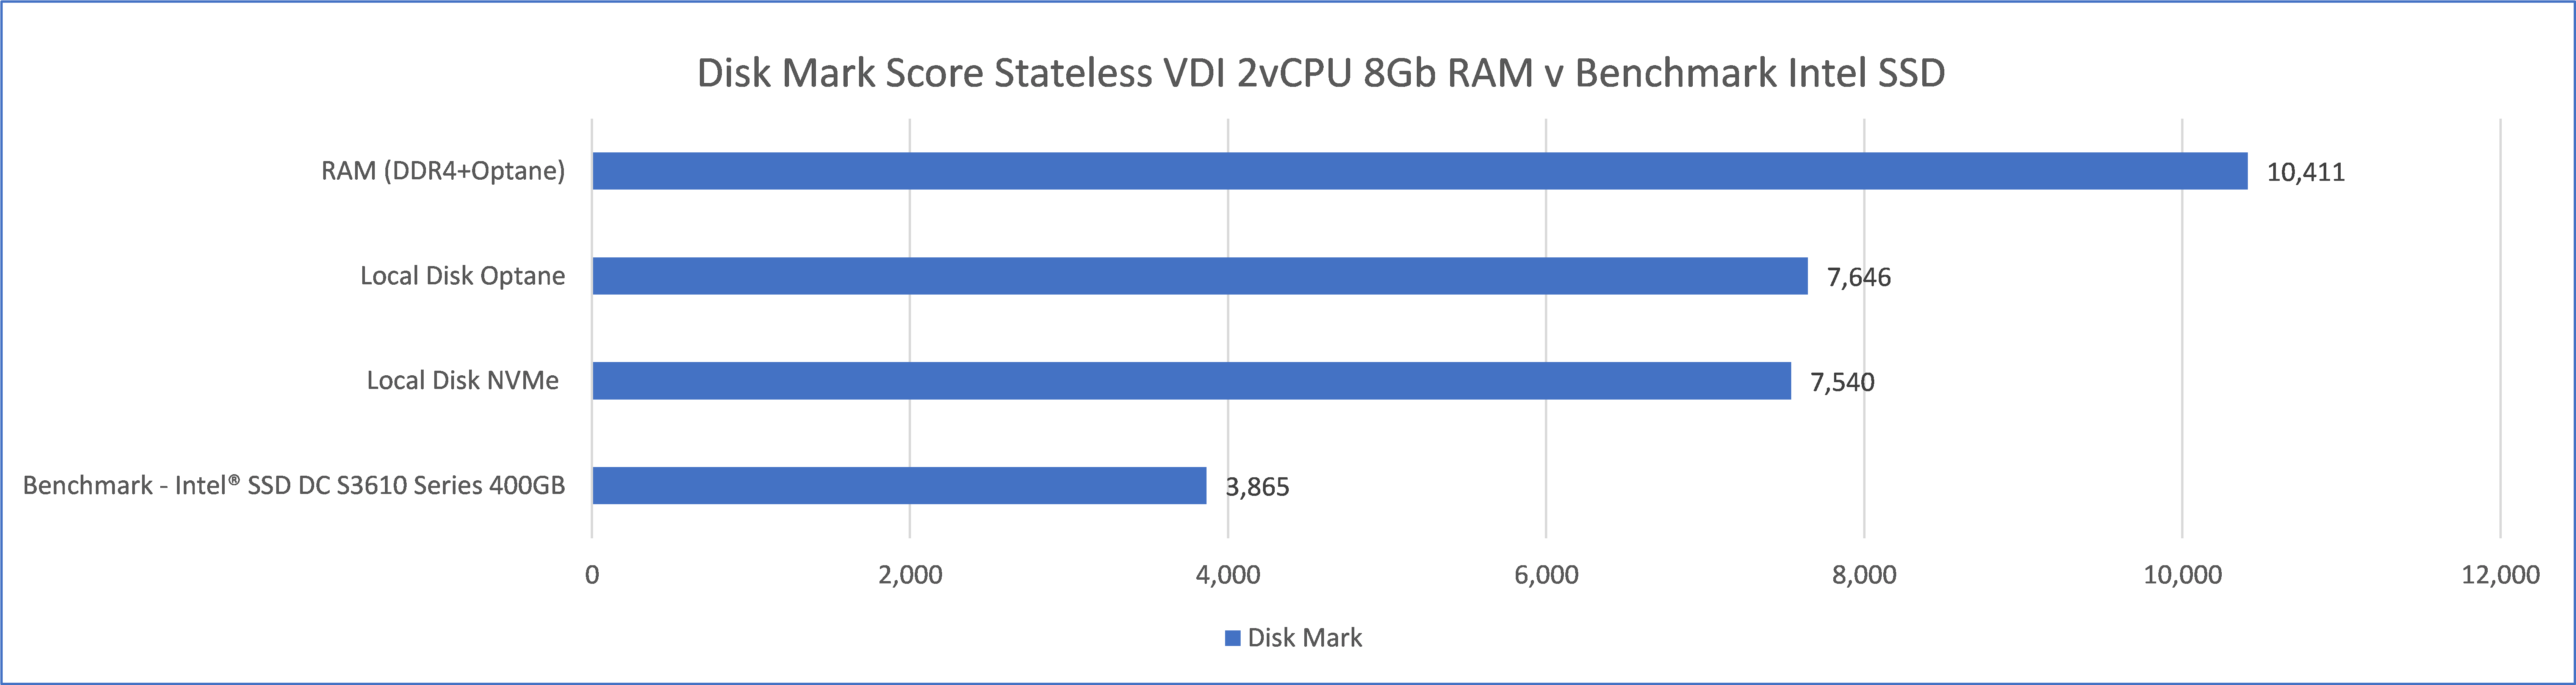 Figure 7:- Disk Mark results for Stateless VDI 2vCPu and 4Gb RAM
Summary Observations
Figure 7:- Disk Mark results for Stateless VDI 2vCPu and 4Gb RAM
Summary Observations
The results the disk mark scores were similar to the Iometer test results with disk performance of the VDI deployed to the DDR4 & Optane RAM combination outperformed the standard SSD’s by almost 3 times and VDI desktops with NVMe and Optane SSD’s by 64% and 36% for the 4Gb RAM and 8Gb RAM VM’s respectively.
Summary Findings
It was clearly established that VDI deployed to RAM storage (which is unique to Hive Fabric) where memory configured with Optane Persistent Memory and a DDR4 cache the overall performance over standard SSD disk and even NVMe and Optane SSD's was significant with results showing a minimum of
50% increase in overall IOPs and Disk Mark® scores
160% higher than standard local NVMe and Optane SSD's
Optane and NVMe SSD's showed performance improvements over standard SSD's, with results for both when used for stateless VDI indicating
50% increase in overall IOPs and Disk Mark® scores almost
200% higher than standard SSD.
To conclude Optane Persistent Memory offers significant performance advantages for VDI infrastructures when deployed with Hive Fabric.